
Background: The COVID-19 crisis has led to historically unprecedented increases in the level of initial Unemployment Insurance (UI) claims filed in California since the start of the crisis in mid-March. Through a partnership with the Labor Market Information Division of the California Employment Development Department, the California Policy Lab is analyzing daily initial UI claims to provide an in-depth and near real-time look at how the COVID-19 crisis is impacting various industries, regions, counties, and types of workers throughout California.
The Policy Briefs are updated on a monthly basis.
Return to the main report page to see all of the policy briefs, data points, and media coverage.
As Crisis Continues, More Unemployed Californians are Receiving UI Benefits
Published February 25, 2021
By
Overview
Historically, the share of unemployed workers receiving regular UI benefits (recipiency rate) in California has been relatively low (as has also been the case in other states).
This Data Point combines administrative data from California’s Employment Development Department (EDD) with monthly Current Population Survey (CPS) data to construct an improved recipiency rate to measure the extent to which unemployed and underemployed Californians are receiving regular UI benefits.
DATA POINT: As Crisis Continues, More Unemployed Californians are Receiving UI Benefits ![]()
PRESS RELEASE: New Research Finds Dramatic Increase in the Share of Unemployed Workers Who Receive UI Benefits in California
Key Research Findings
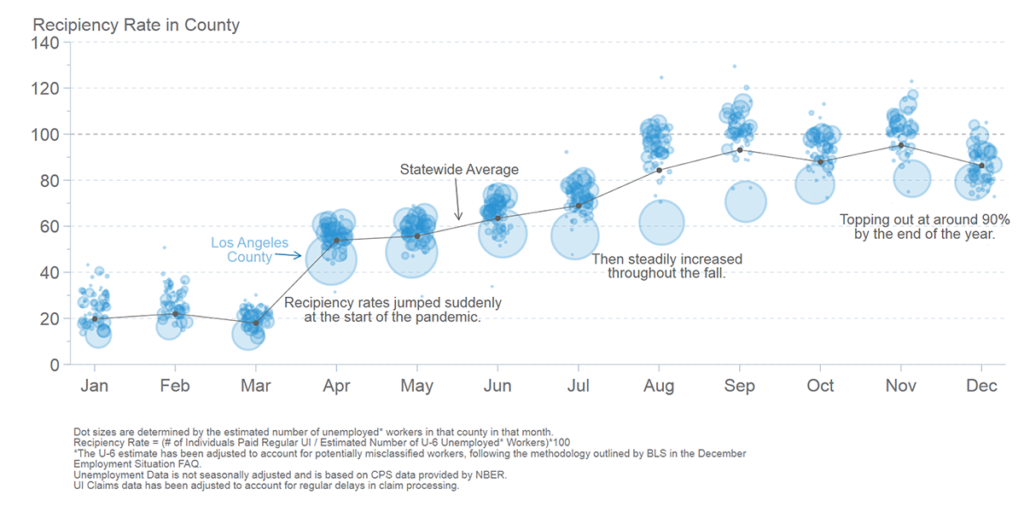
1. Before the crisis (January-March 2020), about one out of every five unemployed (or underemployed) workers in California received regular UI benefits. In April 2020, the first month of the crisis, recipiency rates increased substantially above historic standards, to 50% of unemployed workers. The recipiency rate in California then steadily increased over the next five months, such that by the end of 2020, the number of UI recipients in California was approximately 90% of the number of unemployed or under-employed in the state.
2. There are geographic disparities in the rates of UI benefit collection that correlate with income, race and ethnicity, access to technology, and other social and economic factors. In counties with higher median household incomes, a larger share of their unemployed workers tended to receive UI benefits, while a smaller share of unemployed workers received benefits in counties with higher poverty rates.

Notes: Each dot represents the bivariate correlation between the covariate and our measure of recipiency rates. All variables are at the level of the county. Error bars represent a 95% confidence interval. Our primary source of geographic correlates is ACS 5-year estimates from 2014-2018, the most recent cohort available. The information on COVID confirmed cases is sourced from the Los Angeles Times.
3. CPL’s Recovery Index highlights substantial county-level differences in the economic recovery. Higher-income counties have recovered more quickly than lower-income counties, while counties with a higher share of Black and Hispanic residents have seen slower recoveries than counties with more White residents. This interactive map illustrates each county’s recovery index, and hovering over a county will also display the recipiency rate in the county in December.
Interactive table includes the information included in the above map. To sort, click on column header.